 To provide the highest possible quality of service, you have to keep a close eye on data flows in your app. This is something that, in most cases, requires you to set up the metrics of your code well and set up good monitoring on these metrics.
Metrics are the fastest observability data. They have the quickest output, can be consumed directly (since they are in most of the cases already data series easy to plot), require the smallest throughput, and have the smallest retention footprint. You can find a more detailed analysis of observability planning in my article Planning observability of your system
In microservice architectures (or any service-oriented architecture), it is essential to understand how to use the metrics of distributed integration points for the early identification of problems. This is the topic I am covering in this article.
Let’s first set the stage for a discussion.
The architecture of the system
We are talking about data flows in microservice architecture, so the first thing we want to introduce is the microservices that are doing stuff together.
I decided to go with something that you regularly see nowadays - your friendly neighborhood microservice-based system that still did not outgrow and eat itself, but might as well be on a similar trajectory.
The System has:
- Frontend API microservice that should have been an API gateway, but the architects could not agree where some of the logic goes, so they just left it in (“It is a proper place for it anyways.”).
- Integration Aggregators (A.I.) microservices because some logic did move, but also stayed (if you know what I mean).
- Subsystem microservices - a microservice specialized for a domain aggregate (the way we see it). Eric Evans is proud of us (the way we see it).
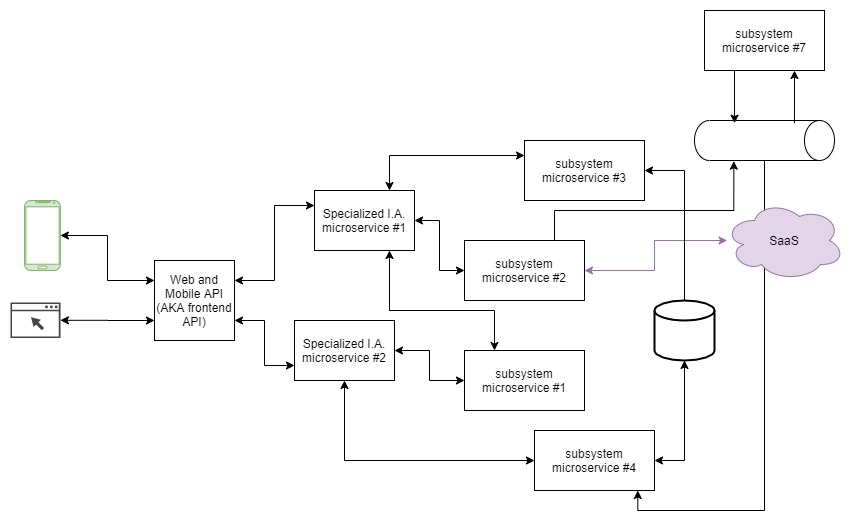
Any similarity to a real-life system is accidental. I would never embarrass anyone by showing their work this way.
Anyways, we got it all in there, arguably even more then we would need for this topic. So, let’s start.
The case I decided to cover is a case of a regular data flow that has multiple calls within it, but synchronously ends after everything is processed. This is one of the last cases that is representable in a straight forward series of specialized diagrams. For more async variations, the approach is mostly the same but there are nuances, and further discussions can be derived (you can expect this in some of my future writings).
The flow
Consider the following sequence diagram:
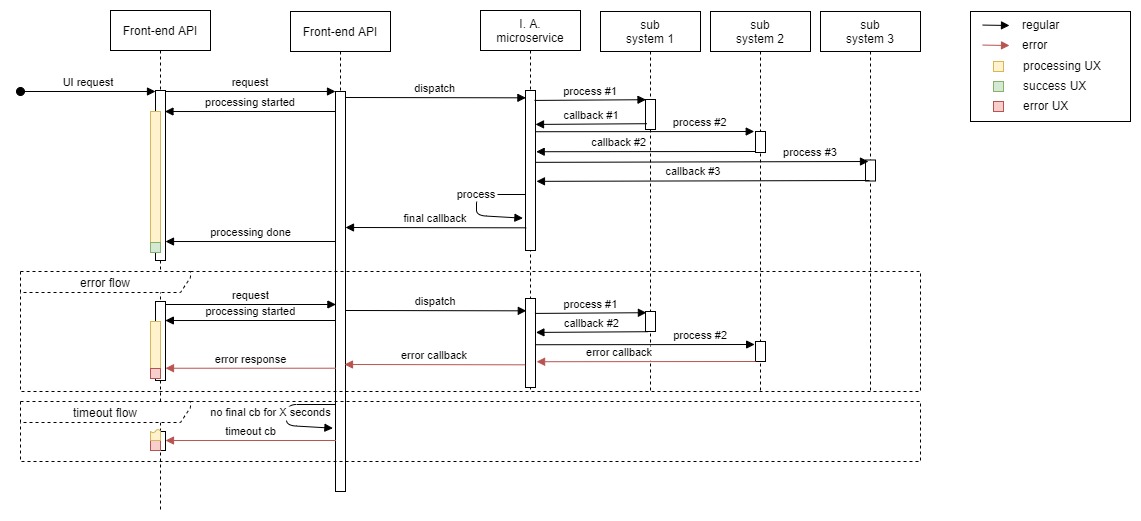
This is your regular backend flow, usually involving a few calls to additional services to get the requested data, aggregate, and prepare and send back to the user. Everything, or most of it done in sequence, and emitting few callbacks to keep the UX proper.
The diagram is also showing two regular subflows:
- When there is an erroneous response to one of the calls.
- Timeout flow, when the call is taking too long to finish (to simplify - frontend call is taking too long).
Observing the flow
Let’s put this diagram under the observability lens and see what we get.
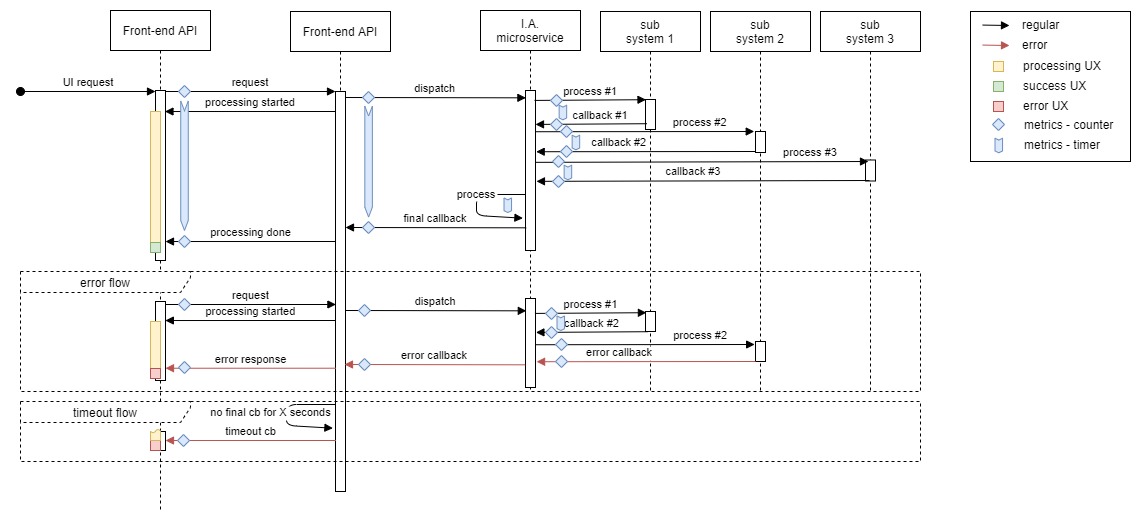
The first thing to note here is that this flow touches almost every part of the system, which is not unusual for imaginary examples at all.
We want to expose metrics about the flow for two reasons:
- Performance measurement
- Flow exactness confirmation (making sure flow is right)
For this kind of measurement we want to employ two types of metrics:
- Counters - displayed as a square/rhomboid shapes
- Timers - displayed as arrow bands
Here I am starting to use Prometheus terminology when talking about metrics, just because Prometheus is my tool of choice for metrics handling and because it is so awesome. It does not make text more difficult to understand by any means, but you will notice some tech language particularities, for example, that metrics get exposed.
In the sequence diagram above you can see my recommendation for measurements and measurement placements for any flow of this type. You should expose noted metrics while you are building this kind of software, so you can always confirm that the live system is performing up the spec and quality standard.
What to measure
For the best observable flow we want to expose:
- Counter for every initiated and completed call - labeled to be relatable to the part of the flow
- Counter for every caught error - labeled to see where it is happening. It is also important to at least have a distinction between 5xx and 4xx calls, but it can depend on the type of systems that are doing the communication. Sometimes some specific errors need to be tracked separately.
- Timer for every successful call. If it is erroneous we do not actually care how much time it took, but you need to keep in mind that it might be important in your particular case.
Tracking the status codes or other important request specifics - to maximize flexibility it is really important to always have exact status codes, the most usual and recommended way is to have it in labels (for example statuscode=”200|401|404|500”). It is mostly quite easy to group and remove granularity using proper queries, but if you do not have enough data it is not possible to generate proper granularity after events are done and measured.
Where to measure
Since we are not measuring processing times or data throughput, but pure data flow metrics, we should focus on:
- Measuring each initiated call by exposing a counter increment for that call, and starting the timer.
- Measure every received response by exposing a counter increment for a successful response, and ending the timer for that call.
-
Measure every erroneous response (that we catch) as a counter increase for error in that particular segment.
If we put it in text like this, it is not obvious, but if you now refer to the diagram with marked metrics, you can see that we are actually measuring the performance of every service by measuring its responses on the side of the consumer service. It is important to note that we have to keep in mind that this way of measurement is intuitive and is logical for understanding performance of the system. Similar to this end-user performance involves networking between the services (ingress, egress, CDN/edge services etc), potential security measures etc. So please keep this in mind.
Why to measure
One word - Quality. The main and overarching topic of this is quality of service provided to the consumer(QoS). In order to provide good and reliable service, you need to know how your system performs. To know how your system performs you should observe the data you exposed.
And what should you observe?
Performance
The performance of your API endpoint is a no-brainer in this case - that is the longest arrow in the successful flow (the arrow closest to the frontend API).
Plotting: We can more or less plot that over time to keep an eye on any changes in performance. To do this we can combine over time plots of different essential metrics. Usually a graph of the total performance of the flow goes nicely on the same dashboard with smaller graphs of performance of separate segments, and in parallel with the call counter (top-left rhomboid).
When the alarm goes off you want to know how much the total performance is off, is there any particularly influential segment in the flow and is the performance degradation related to the number of requests.
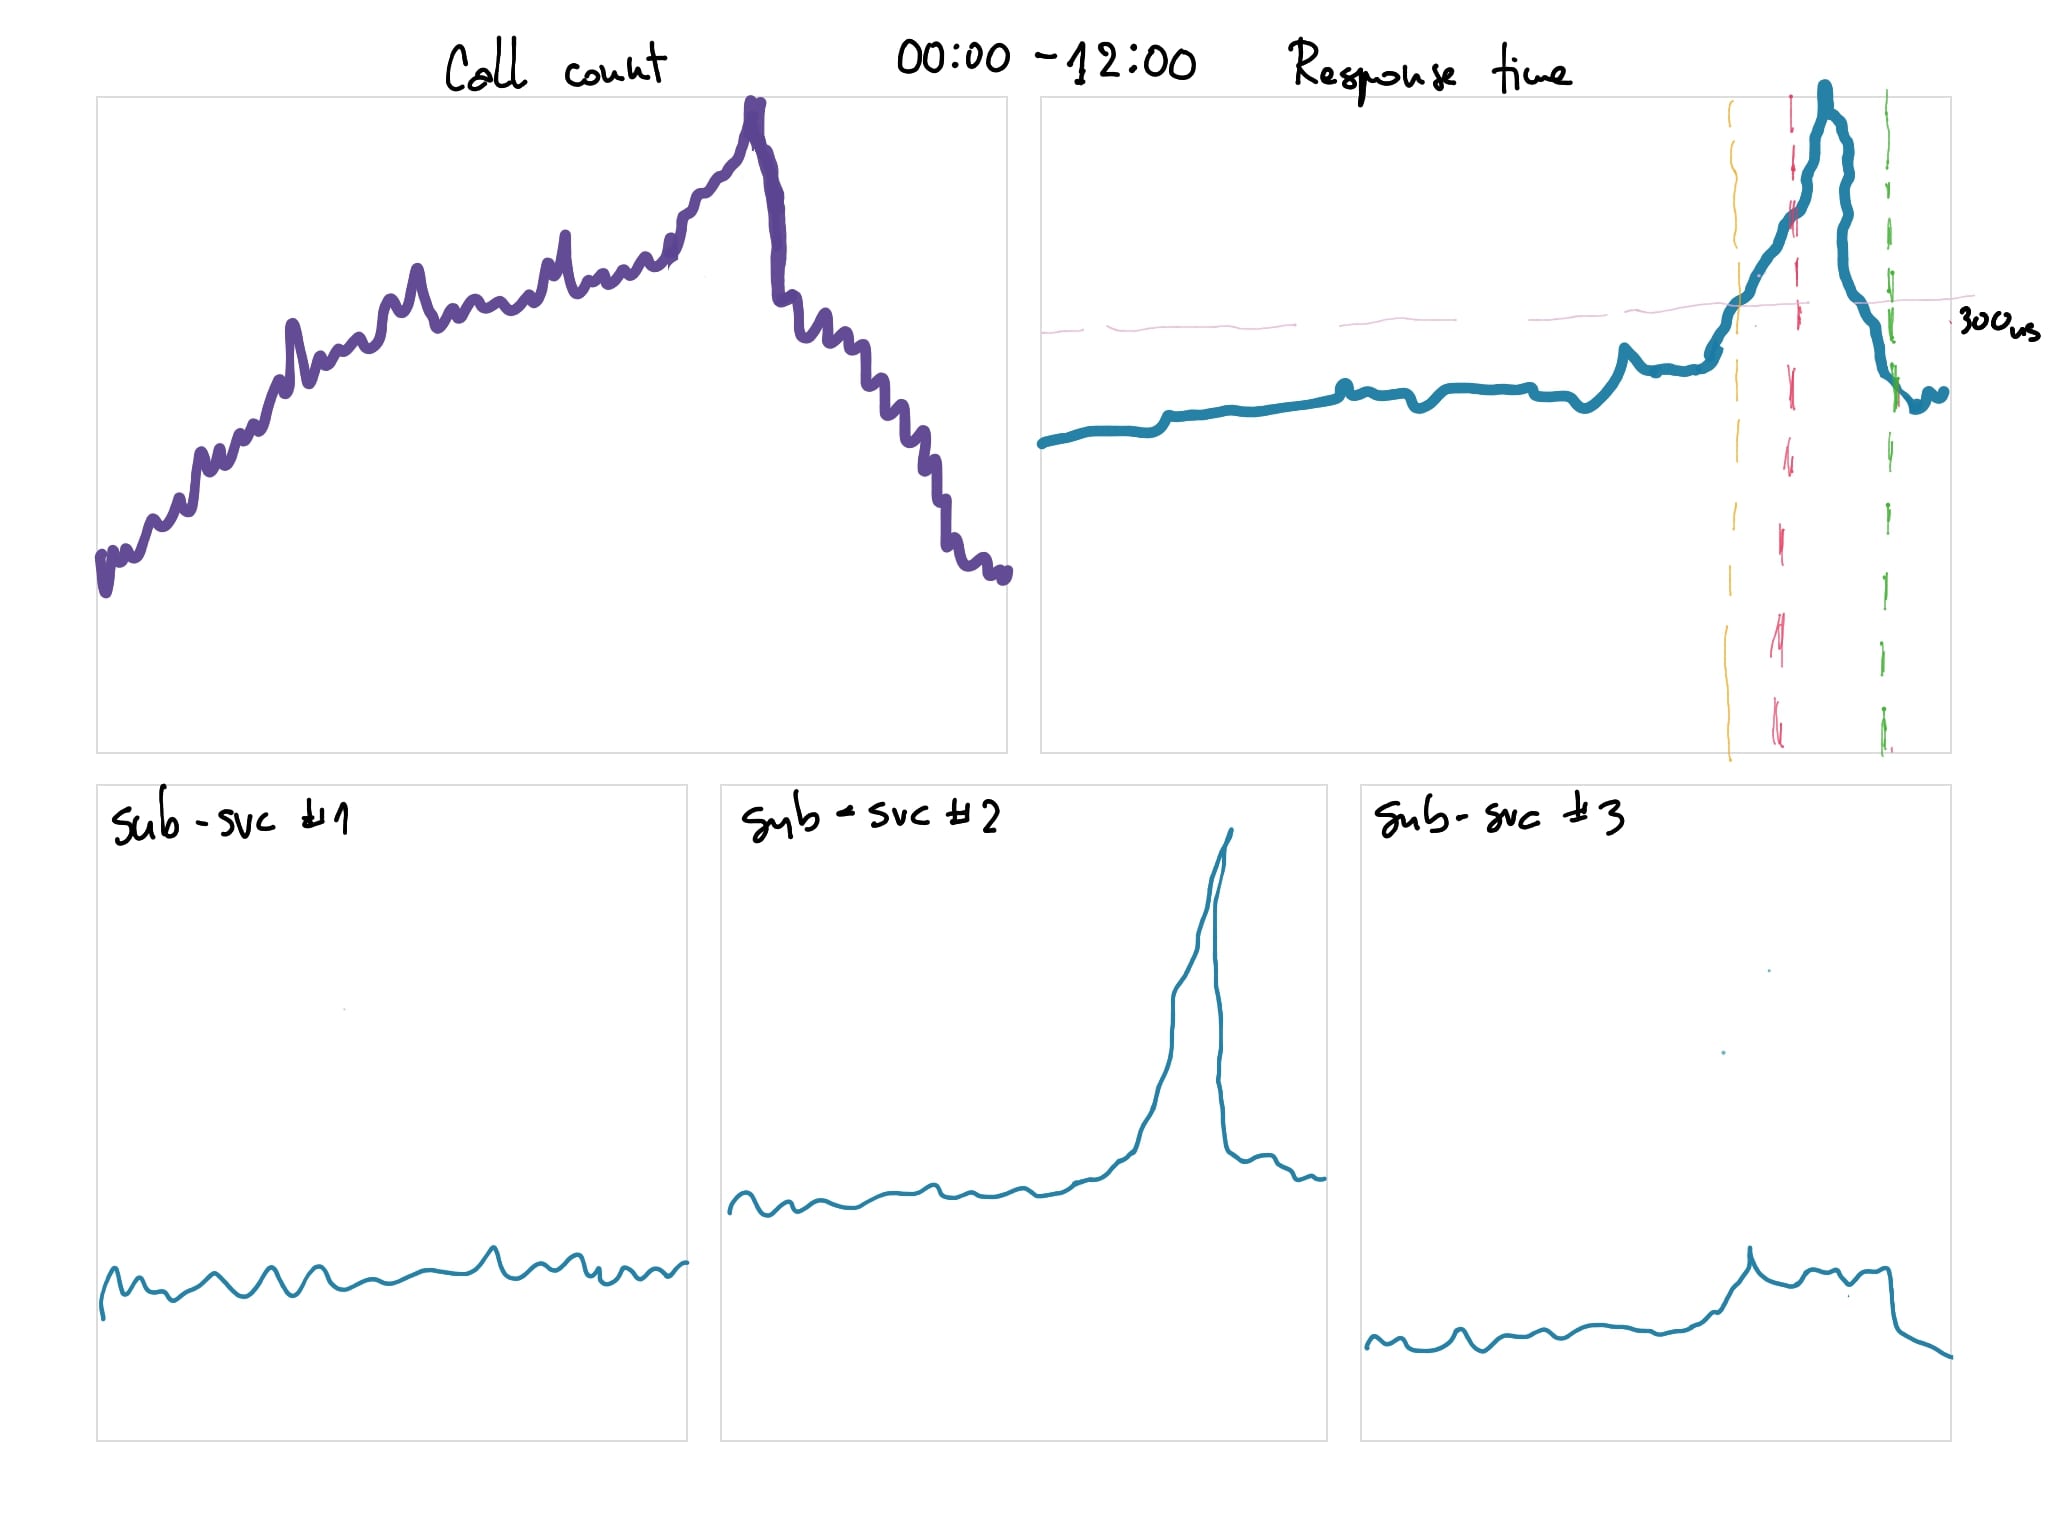
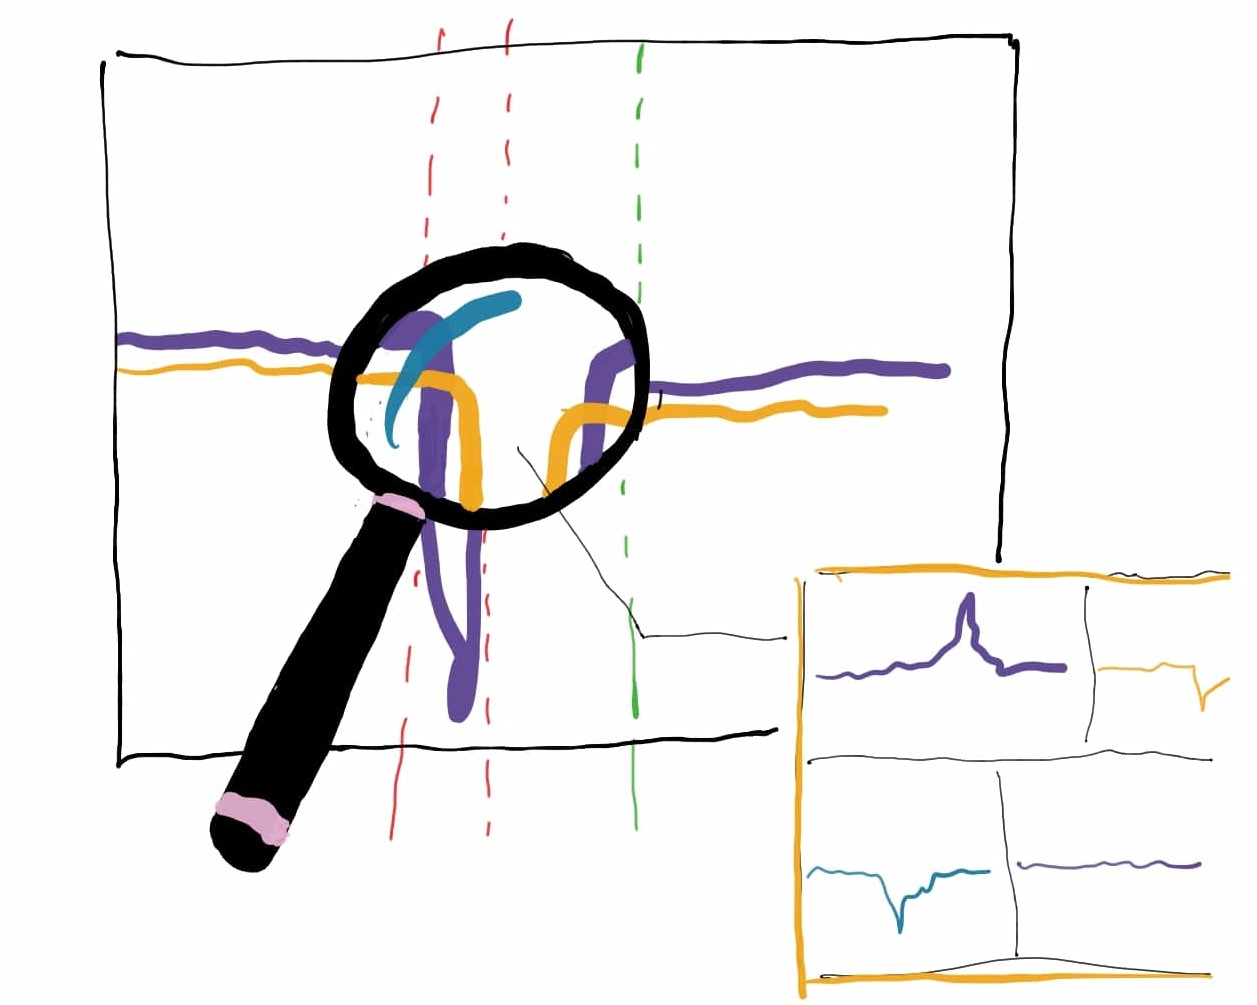
In the example above you see the application performance plot over 12 hour period. At some point performance degradation occurred due to a sudden spike in traffic (number of requests). Observe the total response time and how sub service 2 and sub service 3 both influenced the response time degradation, each in it’s own way.
The yellow line on the main performance plot represents the start of the performance breach (response over 300ms). The red line is an alert that was triggered after a breach going on for some time ( a threshold you set - a few minutes for example). The green line represents a moment when the system is considered to be back to normal
Alerting: In case of performance monitoring there are two approaches that I recommend to set up alerting, and it is not uncommon to see both set up for some flows:
- Based on performance budget (for example - respond within 300ms).
- Based on system performance history (for example - if responses are 20% slower then yesterday at the same time).
You do not get to decide how well you are doing
Make sure to know that this way of measuring, which is proper, dynamic and quality-driven, comes with a caveat. The same way service#1 that is calling service#2 needs to qualify the performance of service#2, your users are qualifying your application’s performance, and you are there to make sure that it is the best performance you can achieve.
This is why it is important to involve all segments of the (eco)system in the general performance measurement.
Error rates
Basically all the counters on error responses are important for monitoring error rates. This measurement is important for the quality of service, but if you are doing things properly these metrics will be important to identify any technical flaws as well.
Plotting: Errors are characterized by status codes between 400 and 599. The same as anything else, you want to track these over time. There are many cases when you would want to actually know the difference between 4xx and 5xx errors so here is a general rule of thumb for choosing one or the other:
- Observe them separately if the subsystem whose errors we are observing has specific 400 behaviors apart from 404 (for example authentication/authorization…) so we can track any potential problem on this side.
- Together if your system does not have special 4xx behaviors and anything in this rage would represent system error.
- In many cases you can exclude 404 errors from erroneous behavior monitoring - on the web it is generally quite usual for people to miss a page address.
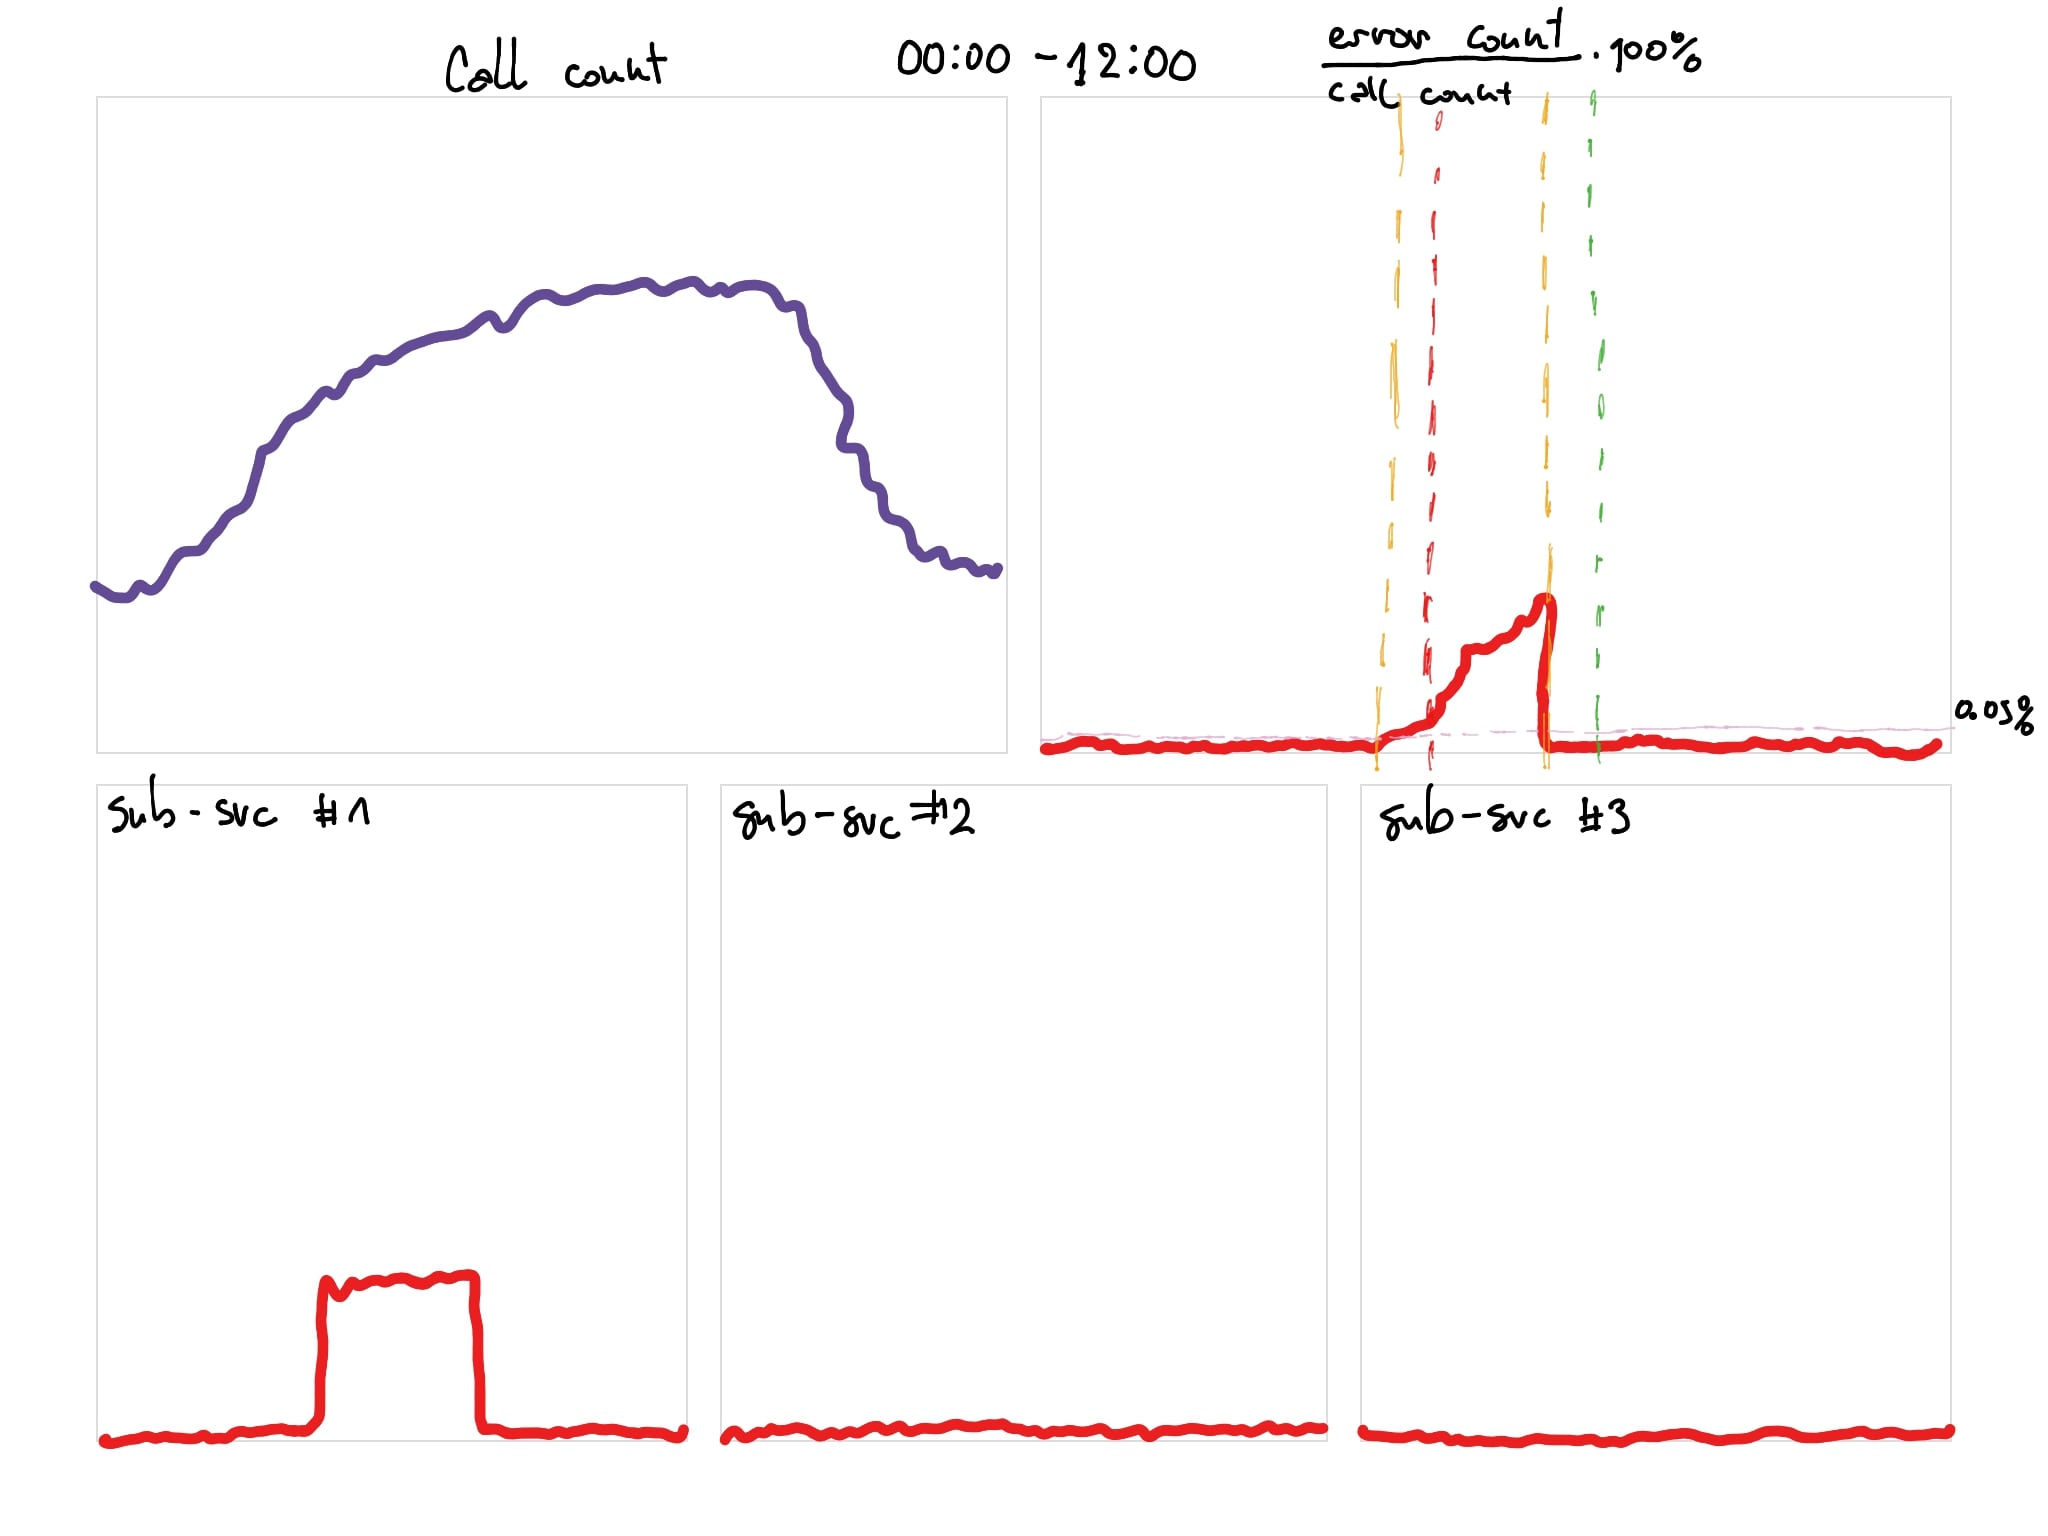
Above we can see the error rate of the endpoint going up because of the high error rate on subservice#1.
We can observe two things from this plot (monitoring dashboard screenshot):
- The high error rate is caused by subservice#1
- The error rate on the outside was ramping up slowly although the problem on the subservice was obviously immediate in nature. This is usually due to a good resilient architecture choice - some responses are cached and errors were only starting to be visible after the cache has expired, so the system as a whole was less impacted.
Alerting: Error rate alerts should be loud and strict. These are usually based on SLOs which means that our alert trigger is if our API breaches the SLO for x period of time. This should be implemented on the end of the whole flow, but also on every segment.
All errors are made equal, but some are more equal than others.
You got to know which errors are costing you the most, not just in terms of money but also in terms of UX and the general appeal of your app. Some examples:
- Is your system a private application and do your users have to be logged in and authenticated? 4xx errors will mean a lot to you, because in behind-the-login apps authentication/authorization errors (401, 403, 405… depending how deep you go in your API design) and many 404s are indicators of unwanted behavior of either app, or users (or both).
- If it is one of the systems you are integrating with (as in our subsystems), and you start receiving 404, that is a cause for immediate alert and attention by your team - something changed on the provider side.
- Does your system have public search functionality? Many 404s are ok for you, especially on search and detail pages because of bots and all other different crawling automations that will just go and try random stuff. Of course, this has many other implications to SEO and such, but this article does not care about that.
- 5xx errors are never ok.
Make sure not to waste time on staring at monitoring dashboards - set up alerts and go do something fun.
Summary
- Code instrumentation is a part of the software development process.
- You need to consider and design the observability of your system with as much attention to detail as when you created the architecture itself.
- The proper perspective to monitor the performance of the service from, is the perspective of the service consumer. Monitoring the internal performance of the service does not account for integration and networking.
- ERRORS BAD.
Comments