This is the guide through the observability space to assist you with planning the observability of your next project.
Observability is the ability of your system to expose data about its performance and behavior so we can further monitor, analyze, and alert on certain trends or changes. Making your system observable requires certain effort in your project.
Why should you care
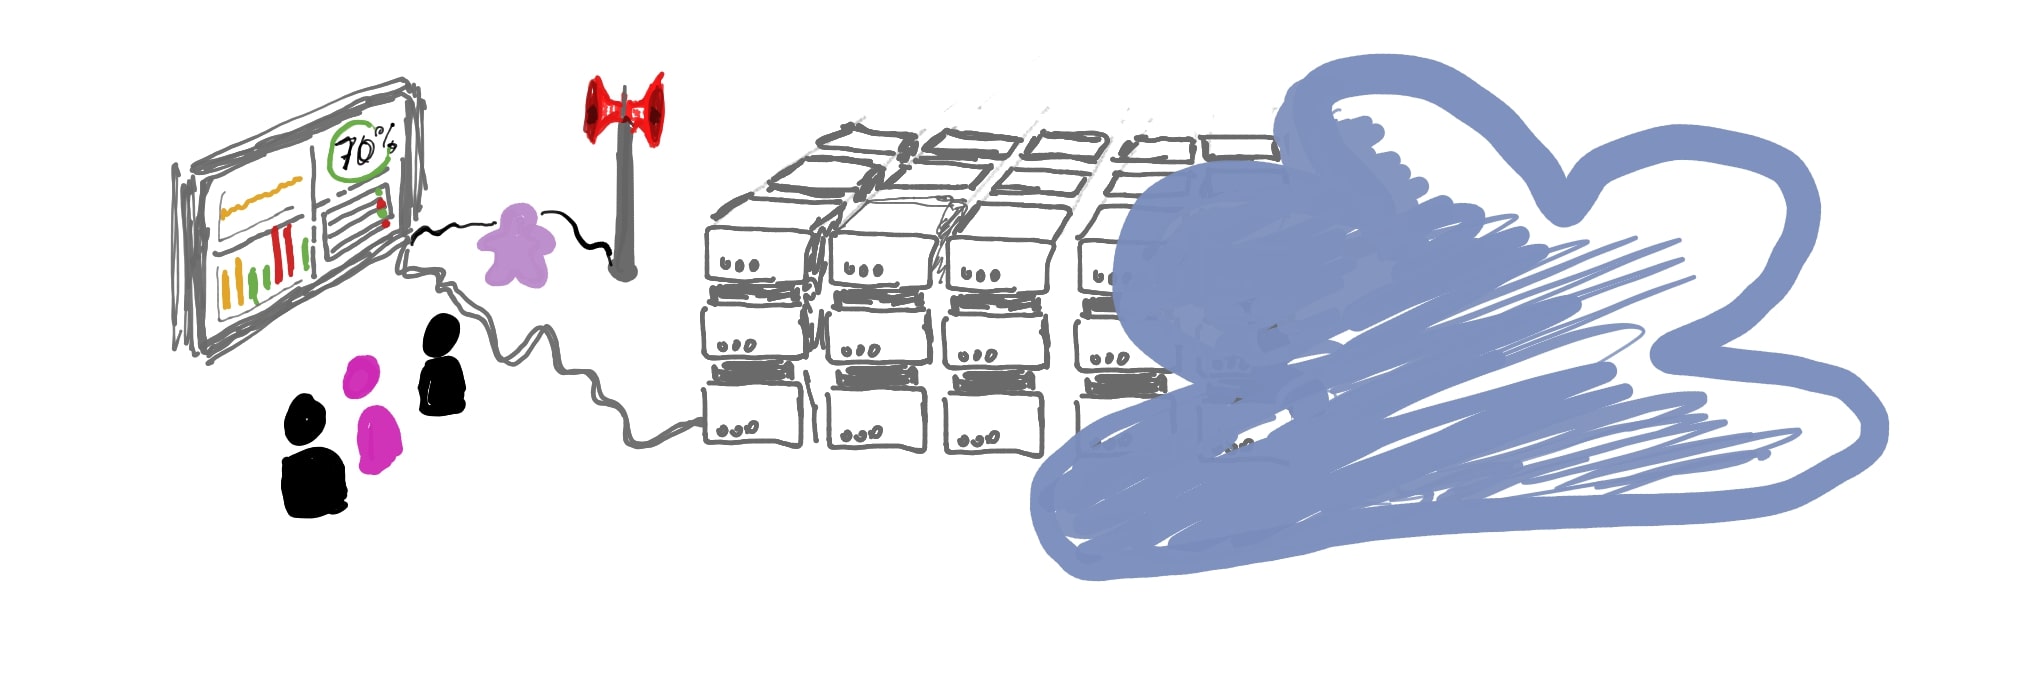
Observability of your system is the top non-functional requirement. In my opinion, not even application performance tops observability. It is absolutely necessary that you know what is happening in your system at any given time and in level of detail necessary to be able to keep everything running smoothly by adequately reacting to change in the system.
Of course, there is a possibility that you do not share this opinion, in which case you would, probably, rather develop your product, do a bit of testing, UAT, and push it out. Probably because it requires a certain amount of work and is considered non-essential as you start. If Google Analytics is all you need, I am not here to argue that, refer back here when you change your mind. If, however, you want to dive into this topic and start planning, I want to share some insights that should help you pin down stuff that is most important for you and prioritize.
There are quite a few aspects of observability in service-oriented architecture, and in this article, I will be focusing on discussing every aspect with a little bit of depth in order to help you better understand, focus and plan developing your observability. To help you plan and have a broader conversation with all the people involved in planning your project, I will provide some insight into the most popular stacks as well and give insights into the most important defining factors.
Your system being observable can mean multiple things on as many levels, but generally, it means that system exposes data that we can consume to:
- Monitor system in real-time.
- Alert or perform some automated task based on defined data state, or rather a change of state.
- Analyze and predict behaviors, requirements etc…
- Do a detailed analysis of the incident or any distinct event in the system.
- Any combination of the above.
Since it is all about using proper tools, let’s spend some time on quick discussion about what we need and what tool/type of observability we choose.
Characterizing capabilities
When we talk observability of the system, the way we are planning it really depends on what we want to achieve. Ultimately, we would love to achieve everything, but some ability to focus and plan would be nice. Let us take a look at some factors to take into account when prioritizing observability.
Main types of data:
- Logs - Old, but gold. The first that ever existed has all the data about what is going on, but slow, hard to process, and needs huge system throughput to bring usage close to real-time. You can still go to the file that was generated last and grep it for a particular phrase or just look for the time when the error happened, which will forever be my favorite thing I ever learned how to do (apart from making pizza from scratch).
- Metrics - Quick, flexible, made for quick availability and low throughput requirement, easy and long retention. Not too much data per unit of information, real-time trend analysis and reaction.
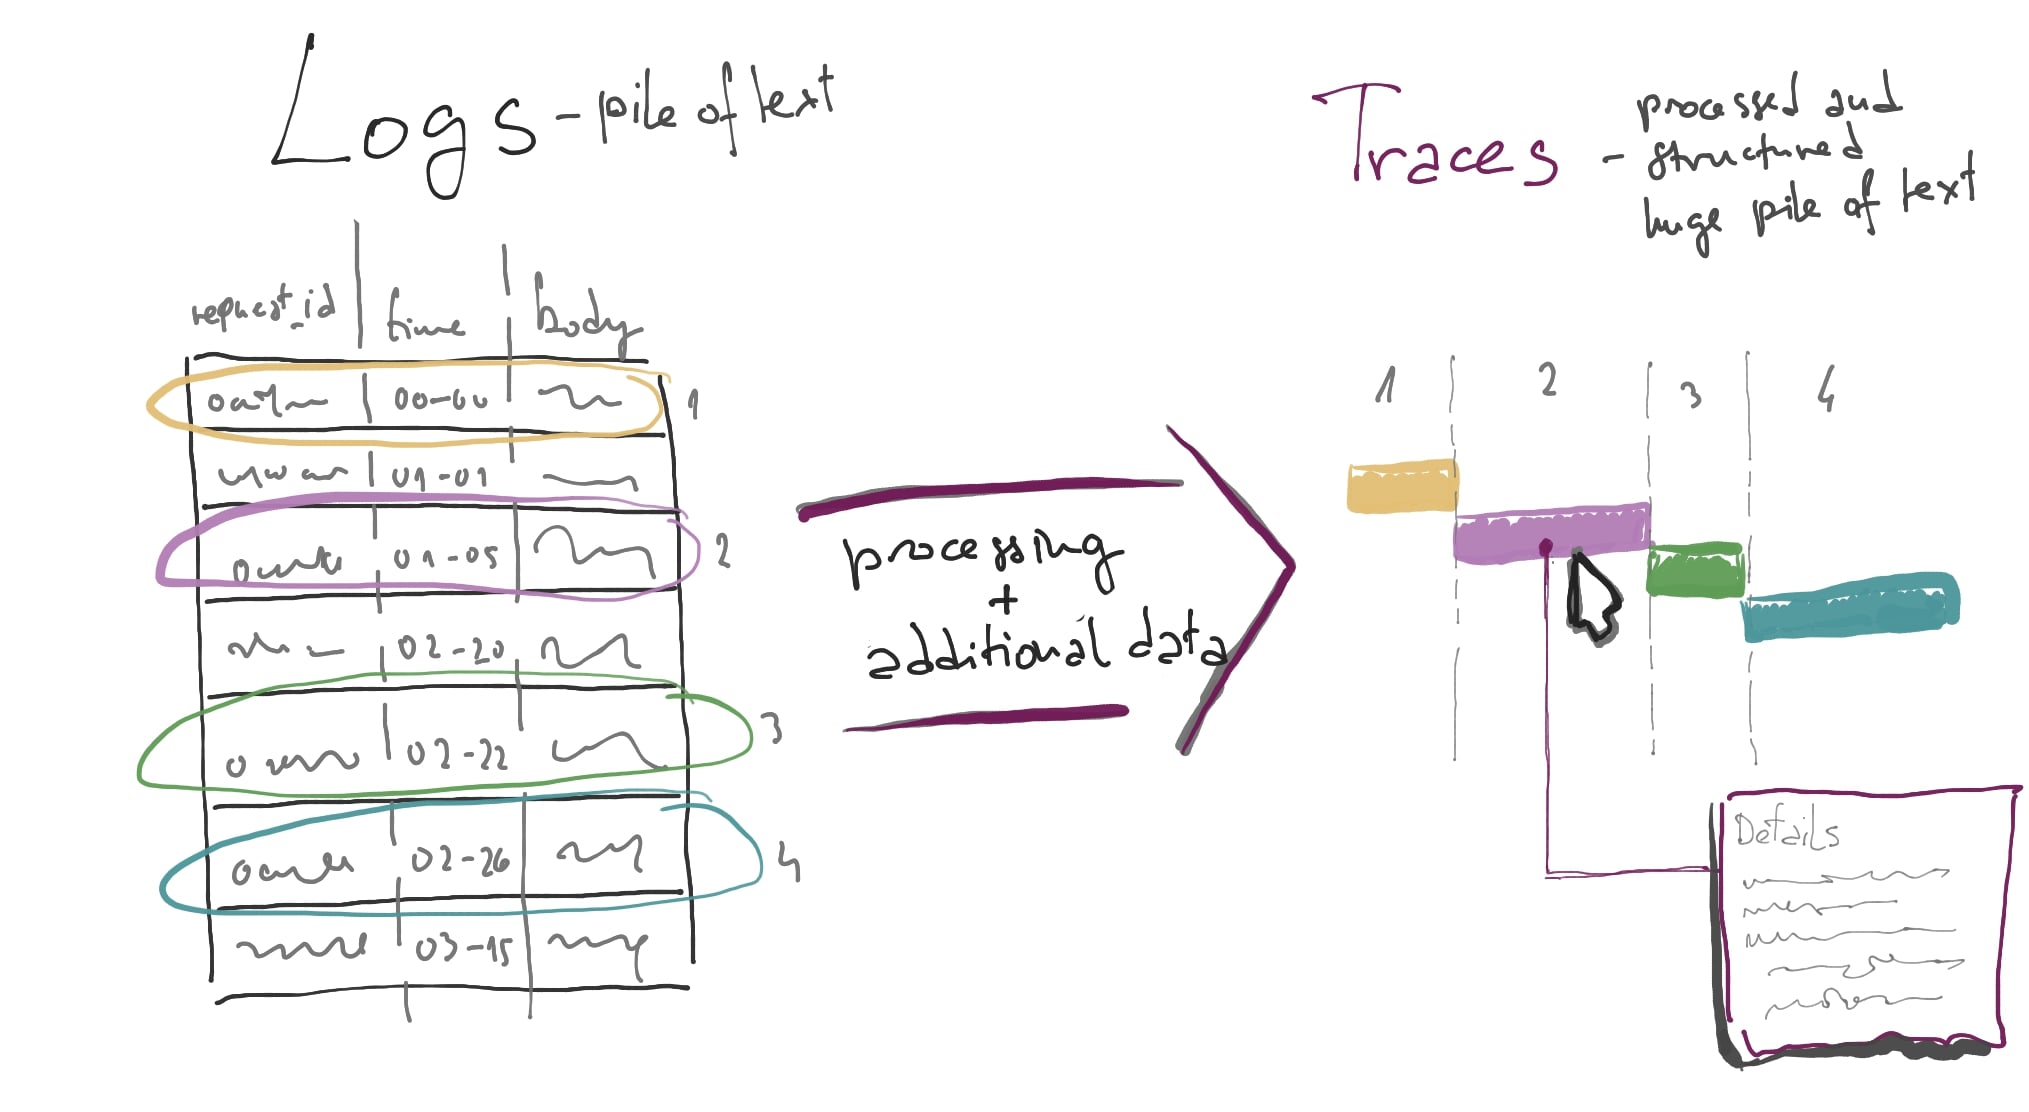
- Traces - Everything you would like to know about the call you made, seems like magic especially in a well-instrumented distributed system. Sometimes slower than logs, but allows for deeper analytics.
Performance qualities:
- Usability - Do metrics allow a good way to monitor and analyze them, with flexibility in data architecture to give enough versatility.
- Speed/throughput requirements - how much metrics system can take before receiving some performance penalty. Also, how fast are the metrics available for consumption/use (both manual and automated).
Way we plan to consume data:
- Monitoring - real-time plotting and observation of system state.
- Alerting and automatic triggers - reacting to events by broadcasting notification or triggering events.
- Analytics - analyzing collected data to gather useful learnings about the system and/or perform root cause analysis (RCA) of the problem in the past (usual case) or ongoing problem (rarer since Analytics is mostly about applying complex algorithms to big data sets to draw conclusions, and that takes time).
We can quickly draft the following table:
| Type | Performance/ Throughput needs | Recommended for |
|---|---|---|
| Logs | Medium / Medium - still lots of text | RCA/Monitoring/Alerting |
| Metrics | Fast / Low - smallest unit of data | Monitoring/Alerting/Analytics |
| Traces | Slow / High - contains lots of data | RCA, Alerting in some setups |
Creating observability
As you are building a system, no matter if it is a huge monolithic application, or a multiservice-something, planning observability you want to achieve will get you places. For that, you’ll have to know what kind of tools you need and what additional infrastructure will it take… of course, but there is also a choice of where to start. It is less obvious, but deciding to do everything might be a costly decision depending on how much time you got to deliver the first version of your system.
DevOps - in this moment it is worth mentioning that for most of the stuff that I write, I assume your goal is full DevOps, and that your team is building everything and running it in all the environments. If you are getting something pre-built, you have an army of engineers or reasonably long timelines there might be a way to get it all in time.
Logging
Generally, you do not need to do anything in order for your system to start gathering logs, logs will be available to you anywhere from the default log directory for the OS of choice to Kubernetes logs. What you will need is everything else - literally.
Going from just a stack of call logs inside a gazillion line file on the disc to a searchable log database that can also be used for a certain level of alerting and many different applications is the matter of planning. I usually recommend two well-known stacks, that differ in the log collection segment:
- ELK - Elastic, Logstash, Kibana which is more standard one
- EFK- Elastic, Fluentd, Kibana which is a more flexible one in terms of data flow management and further design scalability. It is also recommended for Kubernetes.
I guess everyone loves 3-letter abbreviations so nobody bothered to add F at the start of both since it became a standard. F for Filebeat.
Basically, you need to setup EXK and Filebeat, Filebeat will pick up the logs as they arrive to any of the mentioned standard log outputs and send them to a log collector, that gets stored into the Elastic database so logs will be indexed and made searchable and visualizable through Kibana.
Obviously, the more activity you got in your system, the more logs there is, more data throughput becomes crucial for your logs to get to you - Filebeat needs to send logs to Elastic that then needs to index them (on the way there is a throughput of whatever you use). I have seen cases of hundreds of terabytes of logs a day with need of month to 3 months retention… It becomes a whole separate system to maintain.
The good thing is that, when overwhelmed, these setups are quite good in the degrading performance but keeping data, so if you do not run out of physical hardware and everything just halts, your logs may be late to Kibana because elastic can’t index, or they might be stuck in some queue, but they will not be lost. That is, at least, something.
In the wild
Stack itself is relatively easy to deploy with lots of resources available online, from tutorials to docker-composed sets, Terraform submodules and the Helm charts to do it for you. The first hard thing to do is set everything right the first time from the delivery of logs perspective. The second hard thing to do is not to kill your logging stack with too much or too big logs.
Good luck.
Metrics
On the metrics side of things are a lot different than on the logs side of things - although there is a general majority choice of a tool, and thus an approach to it, there are actually two different approaches based on a way metrics are exposed/collected:
- Pull - used by wider accepted and CNCF adopted Prometheus
- Push - used by StatsD
Based on two stand out representatives of two groups, I will provide a quick comparison.
Pull - Prometheus
Prometheus is my current metrics collection stack of choice, developed by SoundCloud and fully promoted to open source in 2015, although it was available for longer.
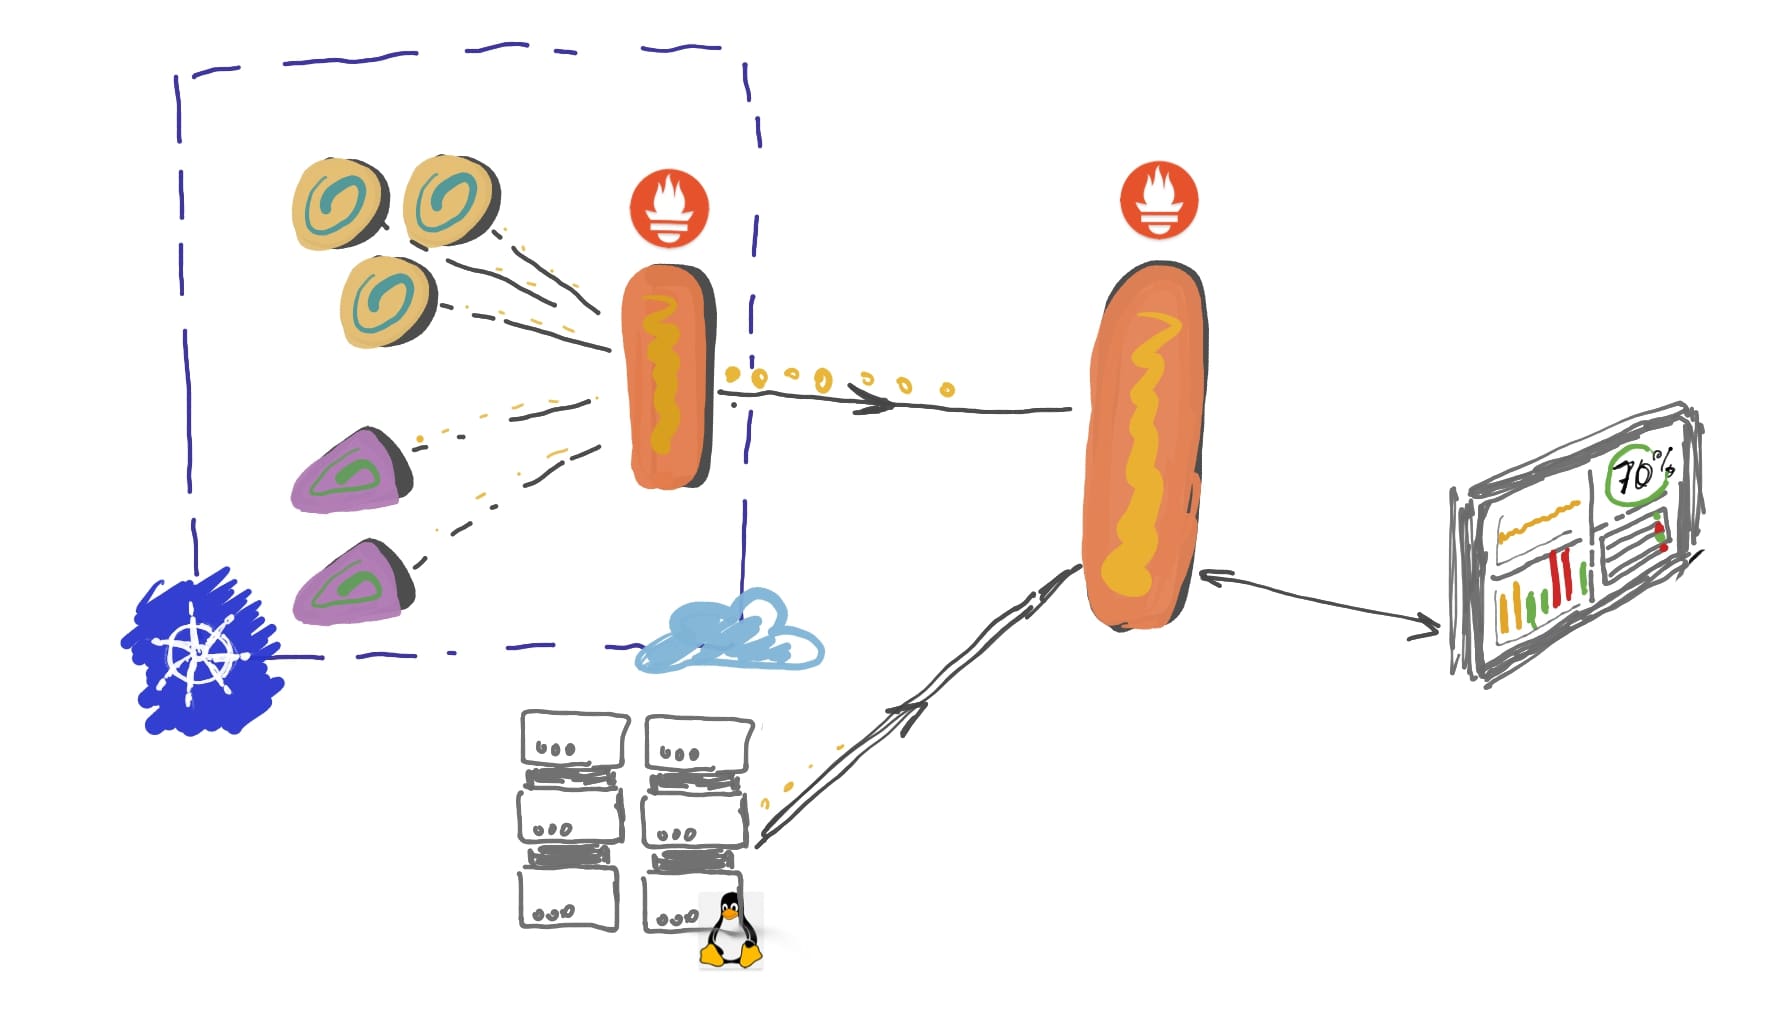
Pull means that the metrics collector is scraping services that are being monitored by it. In turn, the system requires that any service that needs to be monitored by Prometheus exposes metrics. Data exposition format allows “condensation” of the metrics that are exposed, so they basically can accumulate until scraped for both variable scraping intervals, but also the longer periods in case of incidents with collector.
Metrics are kept in the service’s memory until the collector pulls (scrapes) the metrics.
The architecture of the metrics collection and way Prometheus is built gives us two important architectural advantages:
- Resilience - If Prometheus collector dies for some time, metrics are not lost because they are kept in the service’s memory until scraped
- Federation - the same way the service exposes metrics to be collected by Prometheus, Prometheus itself can expose aggregated metrics to be collected by other Prometheus system, allowing for metrics collection scaling by creating a tree hierarchy collection structure known as Federation in the Prometheus ecosystem
Prometheus has a full set of needed components within its ecosystem - it collects metrics in form of time-series and stores them, it also has a alert manager to handle alerts and push gateway to support sort lived services (jobs, container orchestration, serverless…).
There is a certain complexity to using pull metrics that you have to take into consideration - since it scrapes services for metrics you would need service discovery to always know what to scrape, especially in container orchestration space.
In the wild
Prometheus is a multi-component system that is relatively easy to deploy tanks to the community, but it has lots of quirks for you to handle. It will be super useful, and I recommend it wholeheartedly, but be ready to do some maintenance on it as it is a fast data collection and parsing system having many resilience points which often cause stuff like memory leaks and hard drive space overload.
Every time you want to plot any real-life scenario data, you are making mid to high complexity query to Prometheus, which can overload it, especially in high-resolution intensive plots we can make Prometheus less efficient for its main purpose. Luckily, you can record (sort of index/cache) certain queries (rules) and make the whole thing more performant.
Prometheus can be used as a source directly in Grafana, which is the best open source monitoring+analytics frontend dashboard tool out there.
Push - StatsD
The first monitoring stack I could seriously call that was StatsD, developed by Etsy.
Push means that your system is pushing the signals to StatsD all the time.
This simplifies lots of architectural requirements since service discovery is not needed, the service itself needs to know where the StatsD server (also called daemon) is, and that is that it can receive signals from many sources.
I personally think that price in a bit of complexity on the Prometheus side is worth it.
Looking at the stack itself, where Prometheus has everything in one place, StatsD has its daemon and clients (for every language), but everything else needs a custom thing to plug in:
- To read ad transform data you need something like Graphite, that you can later also use as a source for Grafana.
- For alerting you need another module.
In the wild
Fact that the daemon gets hit for every event in your service and that your service needs to make a request every time the event you are measuring is done leads to new requirements on the software engineering side if the number of request to your app grows. You need to sample every metric if you do not want most of your resource consumption to go into metrics. There is this really good anecdote from Etsy that they actually had alerts on metrics sampling, so Ops guys would come for you if you did not sample or you did not sample enough.
The best way to visualize in this case is also Grafana, but in this case you can not use StatsD as a data source directly, you need Graphite.
Sampling - the technique of reducing number of metrics in a way that you are only sending samples of data (that is why it is also known as downsampling). What you do is send one in 100 metrics generated (one in every 100 requests gets measured).
Sampling helps in both push and pull case, but it is more useful in push case since it reduces resource consumption in the collection and storage space needed for retention. In Pull case, it just saves you disk space and some resources for more complex queries.
Tracing
As the data boom hit the industry it did not miss the observability of stuff we are building. Now we can expose every small detail about the long term behavior of our app in the form of a huge amount of data that tracks any request and to end, even in distributed systems.
The main difference between the two large-volume observabilities is that logs in their essence represent a collection of individual events and traces are designed to represent set of connected events and their holistic picture for further analysis. The base of tracing observability is code instrumentation and there are many ways it is done (including connecting log events using request ids), but the currently accepted global standard is OpenTracing API (now part of OpenTelemetry).
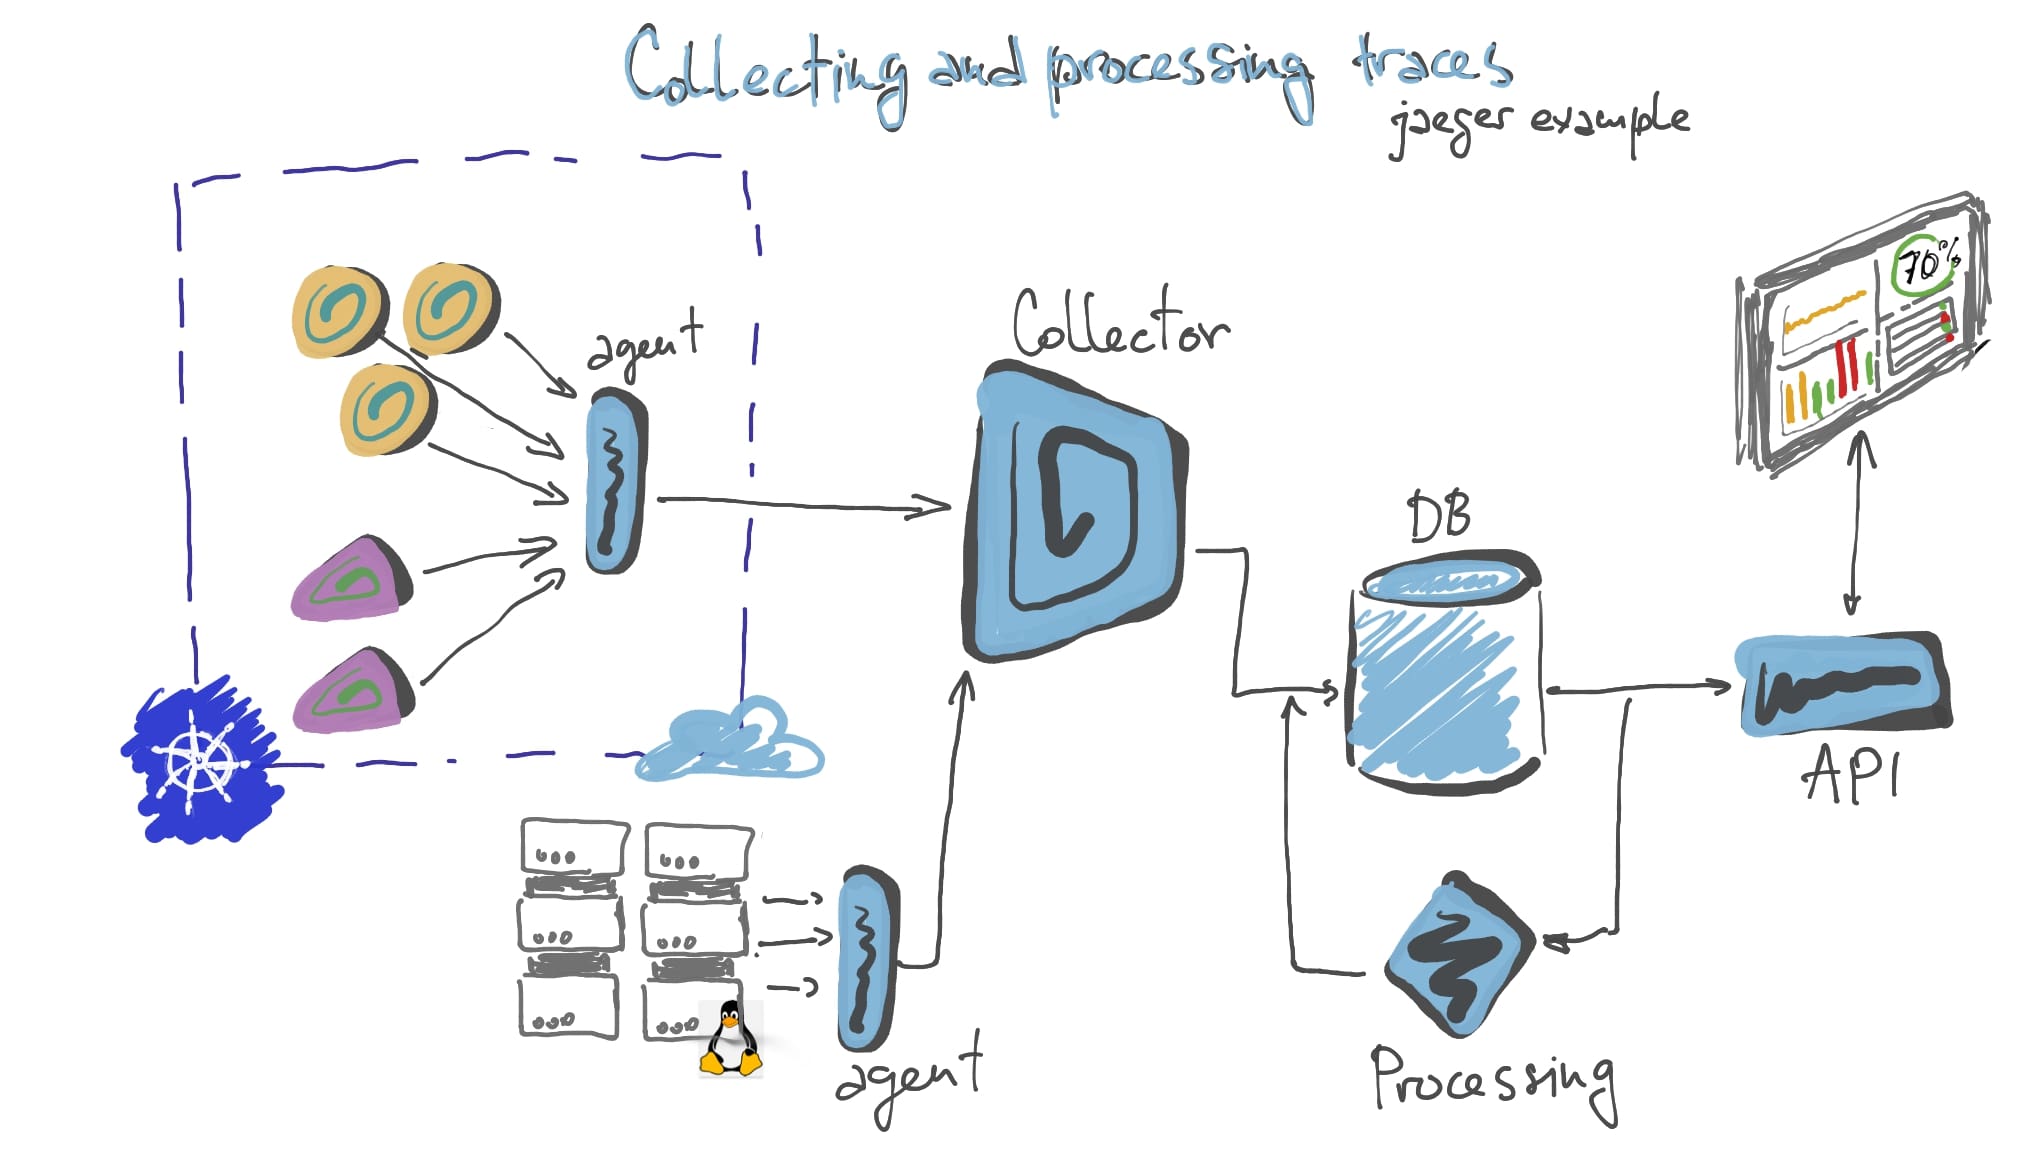
Two tools to mention are Zipkin and Jaeger, developed by Twitter and Uber respectively, both using OpenTracing API and both supporting every programming language in almost every form (framework) out there.
Zipkin is simpler to deploy a more conventional client-server collection system that is oriented towards less complex, non-container-orchestrated systems. Jaeger is more complex, distributed tracing oriented, and preferably deployed to Kubernetes.
In the wild
Tracing tools logically need more complex setups in their backends with fast databases, map/reduce systems, and special scaling needs in order to provide us with the best trace grouping and analysis capability. These are always complex systems of many small and big components to deploy and maintain across the space.
In return, we get the ability to see requests travel through our system, and the capability to identify the exact place where any of the erroneous ones failed and which logs the failure produced etc…
Data inflation!
Summary
- Logs have all the data, but you need a delivery system, database, indexing, and search/dashboard tool in order to be able to use them beyond merely skimming the text in a file on a disk somewhere
- Metrics do not have too much data but they provide an essential way of measuring your system’s performance and reacting to it in real-time
- Tracing is giving us deep insight into the system’s behavior, and holistic analysis of every request. Price is a complex system to gather, store, analyze, and store to be searched and visualized.
- Prometheus is the best
- Use Grafana.
P. S.
I wrote this as a separate article since I realized that intro to another observability article I have been writing can actually be planning and tools insight guide for a broader audience - aiming for all specialties like engineers, architects, tech POs, QA engineers… I hope it worked :D
Comments